Hawaii Food System
To improve the health of our local food system, we need to understand the interdependencies within the food supply chain and the resources & policies that influence them. Tracking imports, exports & locally grown foods/crops by acres, weight, dollars, calories &/or nutrients can begin to highlight gaps & weaknesses within the system, and allow data-driven decisions to more efficaciously move us in a healthier direction.
Food Consumption for State
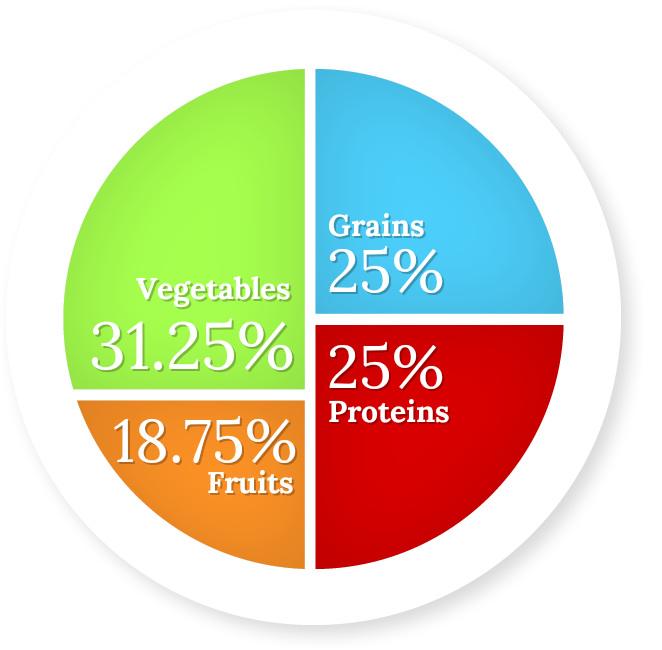
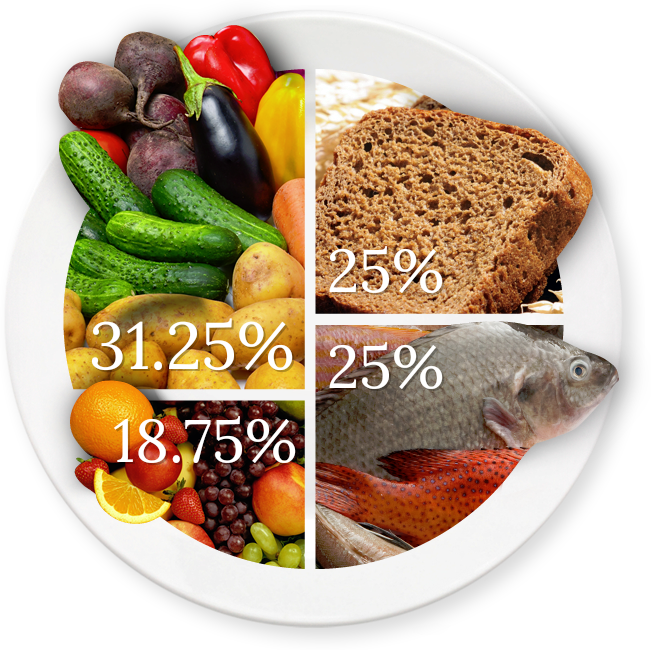
Optimal Consumption
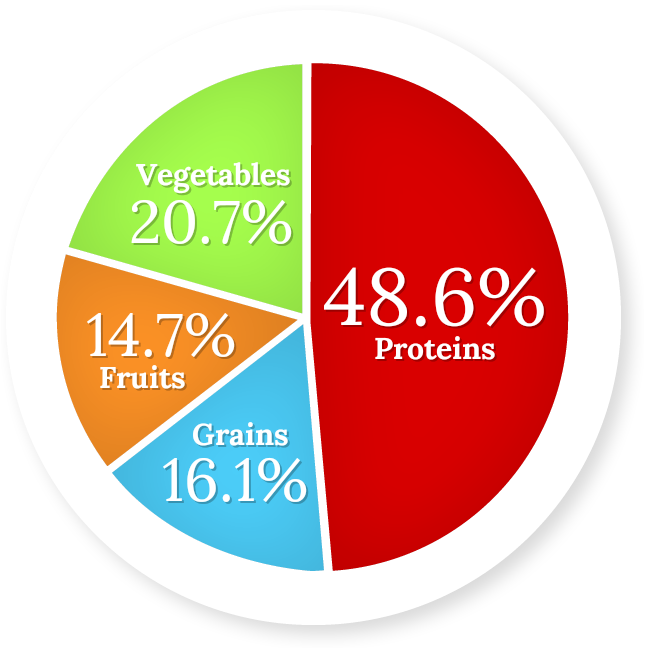
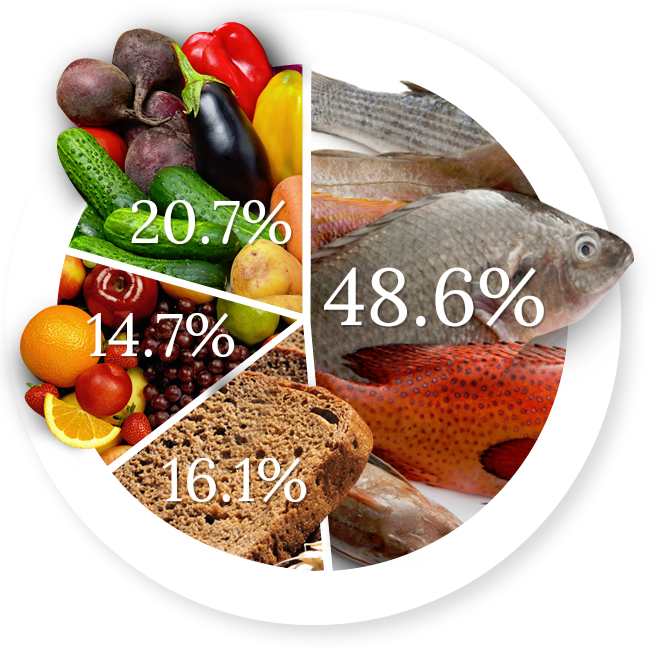
Actual Consumption
Food Consumption by County
Food Waste Per capita

30% Total loss, all levels

47.4% Total loss, all levels

30.4% Total loss, all levels

59.9% Total loss, all levels

53.6% Total loss, all levels
* Sources for these are the USDA ERS.
Acres & Dollars per Commodity Group for Local Production
Animal Proteins
Grains
Vegetables
Fruits & Nuts
Other
* Sources for these are the USDA Census of Agriculture, USDA Quickstatss and USDA NASS.
Local production against Imports for human consumption
* Sources for these are the Freight Analysis Framework – (FAF4), USDA Census of Agriculture, USDA Quickstats and USDA NASS.
* Sources for these are the Freight Analysis Framework – (FAF4), USDA Census of Agriculture, USDA Quickstats and USDA NASS.
Local Production, Imports & Exports
* Sources for these are the Freight Analysis Framework – (FAF4), USDA Census of Agriculture, USDA Quickstats and USDA NASS.
Local Consumption
* food waste is not accounted for in this visualization
** Sources for these are the Freight Analysis Framework – (FAF4), USDA Census of Agriculture, USDA DBEDT Databook, USDA Quickstats, USDA NASS, HTA Historical Visitor Statistics, and USDA ERS.